


Figures
Blanchard
et al. RESULTS
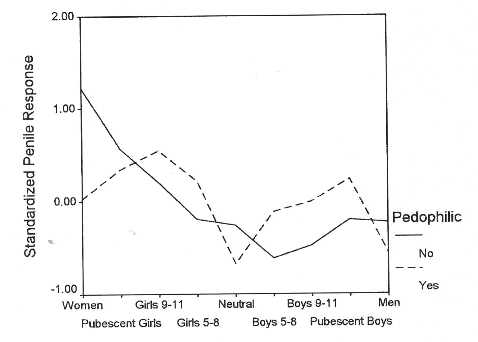
Fig.
1.
Mean
response profiles for the 302 pedophilic and 600 non-pedophilic subjects
diagnosed with the nine-category phallometric test.
[Page
516]
The
pedophiles are represented by the broken line, and the non-pedophiles are
represented by the solid line. Higher standardized scores signify greater penile
responses.
Stimulus
Category
[Back
to text]

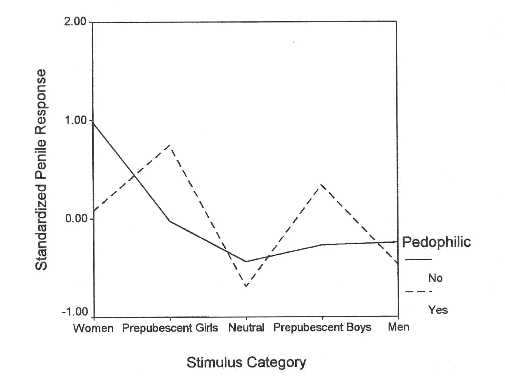
Fig.
2.
Mean response
profiles for the 111 pedophilic and 193 non-pedophilic subjects diagnosed with
the
five-category
phallometric test.
The pedophiles are represented by the broken line, and the
non-pedophiles
are
represented by the solid line. Higher standardized scores signify greater penile
responses.
[Page
517]
[Back
to text]